Field Trial Test Reprot-Dragonfruit
Product Test: MIT pHR, MIT PO-G & MIT PN-60L
Site and Location: Ledong, HaiNan (E 121°58′39″,N 18°31′10″)
Test Period: January 2020 to March 2021
Evaluation Objective:
Evaluation Microbial product in areas of reducing the damage of soil pathogens, improving soil quality and fertility, effect of microbial product in fruit yield increasing and quality improvement.
To proof microbial inoculants and bio-organic fertilizers in improving the soil micro-ecological environment.
Application in details:
Monitor and record of changes of plants, which is improved in root rot, slow root reproduction, and root aging of dragon fruit
| Application | 2 Jan | 2 Feb | 4 Mar |
| Product used |
pHR PO-G PN-60L |
PN-60L | PN-60L |
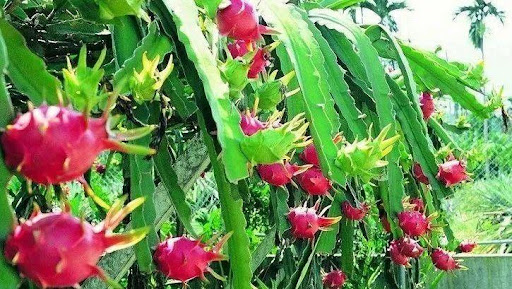
Results summary:
The data and actual results show that the growth rate of branch wideness and thickness of dragon fruit is significantly faster and healthier than that of the control group after using MIT PO-G + MIT pHR + MIT PN-60L.
Detail data collection
Each group collect 2 times data, compare thickness and wideness of test branch
The variance and standard deviation of branch wideness, thickness variance and standard deviation of the 2 experimental groups are as follows.
| Branch of Dragonfruit | Test Group | Benchmark |
| Wideness difference variance | 0.39452 | 0.04552 |
| Standard deviation | 0.62811 | 0.21335 |
| Thickness difference variance | 0.04874 | 0.03882 |
| Standard deviation | 0.22077 | 0.19703 |
The variance and standard deviation of branch wideness in the experimental group were larger than those in the control group;
The variance and standard deviation of branch thickness in the experimental group were larger than those in the control group.
A: Test Group
| 1st data collection | ||||||||||
| Branch Wideness (mm) | Branch Thickness (mm) | |||||||||
| No | Branch | Avg. | No | Branch | Avg. | |||||
| Top | Middle | Bottom | Top | Middle | Bottom | |||||
| 1 | 59.50 | 46.30 | 42.04 | 49.28 | 1 | 6.70 | 6.58 | 5.86 | 6.38 | |
| 2 | 43.00 | 41.80 | 23.88 | 36.23 | 2 | 6.24 | 6.44 | 5.64 | 6.11 | |
| 3 | 41.94 | 40.52 | 31.34 | 37.93 | 3 | 5.86 | 6.42 | 5.14 | 5.81 | |
| 4 | 38.64 | 39.78 | 30.30 | 36.24 | 4 | 5.94 | 5.26 | 4.66 | 5.29 | |
| 5 | 40.84 | 45.10 | 34.76 | 40.23 | 5 | 5.44 | 4.70 | 4.38 | 4.84 | |
| 6 | 37.14 | 36.54 | 29.48 | 34.39 | 6 | 4.36 | 5.20 | 4.20 | 4.59 | |
| 7 | 46.60 | 34.62 | 30.36 | 37.19 | 7 | 5.66 | 5.24 | 4.86 | 5.25 | |
| 8 | 44.34 | 35.78 | 32.14 | 37.42 | 8 | 5.34 | 4.72 | 4.20 | 4.75 | |
| 9 | 47.34 | 37.36 | 32.08 | 38.93 | 9 | 5.12 | 5.58 | 5.20 | 5.30 | |
| 10 | 36.78 | 30.02 | 24.74 | 30.51 | 10 | 4.60 | 5.08 | 4.24 | 4.64 | |
| 2nd data collection | ||||||||||
| Branch Wideness (mm) | Branch Thickness (mm) | |||||||||
| No | Branch | Avg. | No | Branch | Avg. | |||||
| Top | Middle | Bottom | Top | Middle | Bottom | |||||
| 1 | 60.26 | 46.82 | 42.64 | 49.91 | 1 | 6.72 | 6.58 | 6.28 | 6.53 | |
| 2 | 44.32 | 42.38 | 30.64 | 39.11 | 2 | 6.66 | 6.54 | 6.42 | 6.54 | |
| 3 | 43.12 | 41.16 | 31.68 | 38.65 | 3 | 6.20 | 6.60 | 5.80 | 6.20 | |
| 4 | 39.34 | 40.34 | 32.52 | 37.40 | 4 | 6.08 | 6.02 | 5.58 | 5.89 | |
| 5 | 41.40 | 46.20 | 35.70 | 41.10 | 5 | 5.66 | 5.18 | 4.82 | 5.22 | |
| 6 | 38.64 | 37.78 | 30.78 | 35.73 | 6 | 4.98 | 6.26 | 4.88 | 5.37 | |
| 7 | 47.72 | 35.82 | 31.00 | 38.18 | 7 | 5.88 | 5.32 | 5.70 | 5.63 | |
| 8 | 45.40 | 36.30 | 35.76 | 39.15 | 8 | 5.40 | 5.90 | 5.08 | 5.46 | |
| 9 | 48.58 | 39.04 | 34.28 | 40.63 | 9 | 6.22 | 6.52 | 5.96 | 6.23 | |
| 10 | 37.98 | 31.28 | 25.76 | 31.67 | 10 | 4.98 | 5.46 | 4.78 | 5.07 | |
The statistics data as follows
| No | Branch wideness (mm) | No | Branch thickness (mm) | ||||
| Avg. 1 | Avg. 2 | Diff (x) | Avg. 1 | Avg. 2 | Diff (x) | ||
| 1 | 49.28 | 49.91 | 0.63 | 1 | 6.38 | 6.53 | 0.15 |
| 2 | 36.23 | 39.11 | 2.88 | 2 | 6.11 | 6.54 | 0.43 |
| 3 | 37.93 | 38.65 | 0.72 | 3 | 5.81 | 6.20 | 0.39 |
| 4 | 36.24 | 37.40 | 1.16 | 4 | 5.29 | 5.89 | 0.60 |
| 5 | 40.23 | 41.10 | 0.87 | 5 | 4.84 | 5.22 | 0.38 |
| 6 | 34.39 | 35.73 | 1.34 | 6 | 4.59 | 5.37 | 0.78 |
| 7 | 37.19 | 38.18 | 0.99 | 7 | 5.25 | 5.63 | 0.38 |
| 8 | 37.42 | 39.15 | 1.73 | 8 | 4.75 | 5.46 | 0.71 |
| 9 | 38.93 | 40.63 | 1.70 | 9 | 5.30 | 6.23 | 0.93 |
| 10 | 30.51 | 31.67 | 1.16 | 10 | 4.64 | 5.07 | 0.43 |
| Average (x1) | 1.32 | Average (y1) | 0.52 | ||||
B: Benchmark/Compare group
|
1st data collection |
||||||||||
|
Branch Wideness (mm) |
Branch Thickness (mm) |
|||||||||
|
No |
Branch |
Avg. |
No |
Branch |
Avg. |
|||||
|
Top |
Middle |
Bottom |
Top |
Middle |
Bottom |
|||||
|
1 |
47.98 |
41.44 |
28.38 |
39.27 |
1 |
5.72 |
5.44 |
4.60 |
5.25 |
|
|
2 |
41.38 |
34.32 |
32.32 |
36.01 |
2 |
4.98 |
5.14 |
4.32 |
4.81 |
|
|
3 |
40.40 |
40.20 |
38.10 |
39.57 |
3 |
5.98 |
7.56 |
7.68 |
7.07 |
|
|
4 |
44.72 |
45.78 |
42.00 |
44.17 |
4 |
5.52 |
8.50 |
6.90 |
6.97 |
|
|
5 |
42.00 |
42.92 |
39.78 |
41.57 |
5 |
6.14 |
6.64 |
6.24 |
6.34 |
|
|
6 |
47.02 |
45.22 |
37.10 |
43.11 |
6 |
5.98 |
5.60 |
4.90 |
5.49 |
|
|
7 |
42.04 |
35.98 |
30.52 |
36.18 |
7 |
4.62 |
4.98 |
4.10 |
4.57 |
|
|
8 |
45.62 |
41.24 |
30.42 |
39.09 |
8 |
4.52 |
4.96 |
4.48 |
4.65 |
|
|
9 |
44.56 |
39.38 |
34.76 |
39.57 |
9 |
5.86 |
6.58 |
6.86 |
6.43 |
|
|
10 |
34.20 |
36.70 |
32.10 |
34.33 |
10 |
5.00 |
5.38 |
4.60 |
4.99 |
|
|
2nd data collection |
||||||||||
|
Branch Wideness (mm) |
Branch Thickness (mm) |
|||||||||
|
No |
Branch |
Avg. |
No |
Branch |
Avg. |
|||||
|
Top |
Middle |
Bottom |
Top |
Middle |
Bottom |
|||||
|
1 |
48.00 |
42.10 |
29.36 |
39.82 |
1 |
5.92 |
5.86 |
4.88 |
5.55 |
|
|
2 |
42.32 |
36.16 |
32.72 |
37.07 |
2 |
5.10 |
5.82 |
4.88 |
5.27 |
|
|
3 |
40.96 |
40.56 |
38.60 |
40.04 |
3 |
6.18 |
7.60 |
8.04 |
7.27 |
|
|
4 |
44.98 |
46.64 |
42.26 |
44.63 |
4 |
5.58 |
8.54 |
7.18 |
7.10 |
|
|
5 |
42.56 |
44.10 |
40.20 |
42.29 |
5 |
6.30 |
7.00 |
6.46 |
6.59 |
|
|
6 |
47.10 |
47.00 |
37.80 |
43.97 |
6 |
6.26 |
5.78 |
5.16 |
5.73 |
|
|
7 |
42.36 |
36.84 |
31.32 |
36.84 |
7 |
4.94 |
5.22 |
4.40 |
4.85 |
|
|
8 |
46.06 |
41.82 |
31.72 |
39.87 |
8 |
5.14 |
5.52 |
5.32 |
5.33 |
|
|
9 |
45.12 |
40.08 |
36.08 |
40.43 |
9 |
6.06 |
7.10 |
7.62 |
6.93 |
|
|
10 |
36.48 |
37.00 |
32.82 |
35.43 |
10 |
5.40 |
6.02 |
5.76 |
5.73 |
|
The statistics data as follows
|
No |
Branch wideness (mm) |
No |
Branch thickness (mm) |
||||
|
Avg. 1 |
Avg. 2 |
Diff (x) |
Avg. 1 |
Avg. 2 |
Diff (x) |
||
|
1 |
39.27 |
39.82 |
0.55 |
1 |
5.25 |
5.55 |
0.30 |
|
2 |
36.01 |
37.07 |
1.06 |
2 |
4.81 |
5.27 |
0.46 |
|
3 |
39.57 |
40.04 |
0.47 |
3 |
7.07 |
7.27 |
0.20 |
|
4 |
44.17 |
44.63 |
0.46 |
4 |
6.97 |
7.10 |
0.13 |
|
5 |
41.57 |
42.29 |
0.72 |
5 |
6.34 |
6.59 |
0.25 |
|
6 |
43.11 |
43.97 |
0.86 |
6 |
5.49 |
5.73 |
0.24 |
|
7 |
36.18 |
36.84 |
0.66 |
7 |
4.57 |
4.85 |
0.28 |
|
8 |
39.09 |
39.87 |
0.78 |
8 |
4.65 |
5.33 |
0.68 |
|
9 |
39.57 |
40.43 |
0.86 |
9 |
6.43 |
6.93 |
0.50 |
|
10 |
34.33 |
35.43 |
1.10 |
10 |
4.99 |
5.73 |
0.74 |
|
Average (x1) |
0.75 |
Average (y1) |
0.38 |
||||
Actual effect from the overall growth and root system of the experimental group and the control group.
a) Overall growth of dragonfruit plants on 20 March 2021


Compared with the control group, the experimental group has vigorous branches, new branches with sufficient power, strong upward growth, dark green, thick and wide branches, and high gloss.
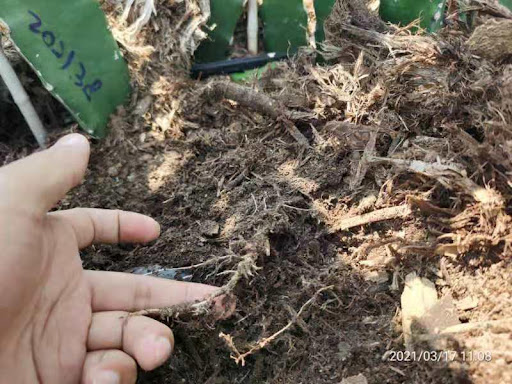
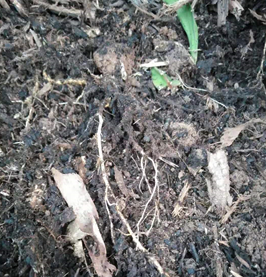
b) Appearance of roots
Test Group (right)
Control (left)
08 March
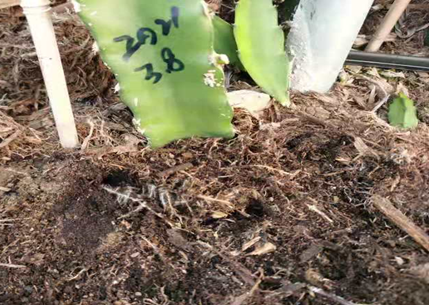

17 March
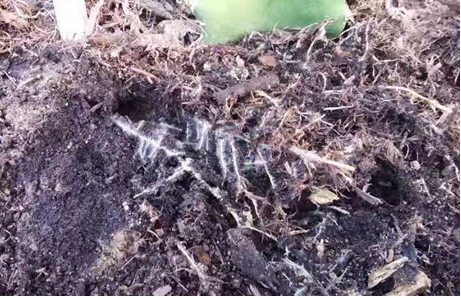
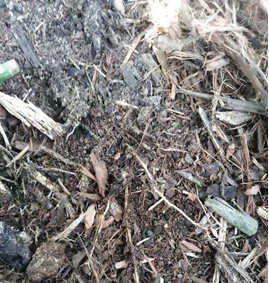
The root of dragon fruit is not only not aging, but also a large number of secondary roots and capillary roots grow, and no disease occurs, thereby greatly improving the absorption and utilization rate of fertilizer, and then promoting the vigorous growth of the branches of the above-ground part of the dragon fruit, and the new branches have sufficient power and grow upward. It has strong strength, thick green, thick and wide branches, and high gloss, which lays a good foundation for subsequent flowering and fruit setting and stable and high yield.
