Cherry Tomato Test Farm Report
Test period: 12 July 2021 to 21 October 2021
Site and Location: Lim Chu Kang Lane 4
Crop type: Cherry Tomato
Test product: Group 1: Control, Group 2: 100% fertilizer, Group 3 :50% fertilizer, PN,PP
Experimental Set-up: 30 plants per group
Environment condition: Outdoor
Prepared by: Johnny Chong
Completion Date: 21 October 2021
Data Compilation
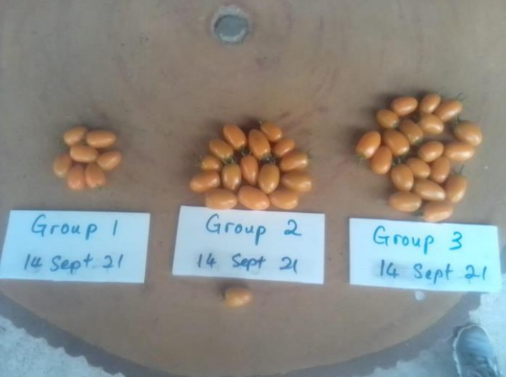
Harvesting data



Data Analysis
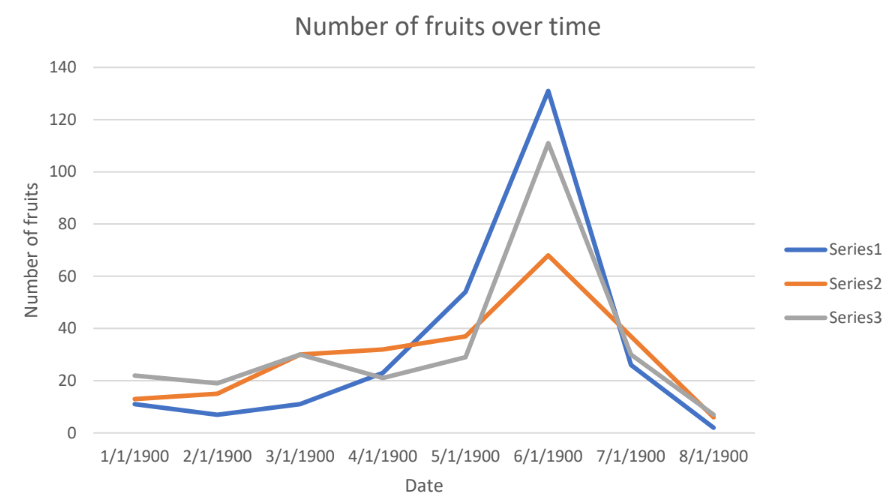
Based on the graph above, we can observe that groups 2 and 3 have a greater harvest at an earlier time compared to group 1. As the harvest continues, we observe that the harvest for group 1 overtakes groups 2 and 3 in terms of number of fruits. It is observed that in the long run, group 1 is able to produce a high amount of fruits compared to group 2 and 3.
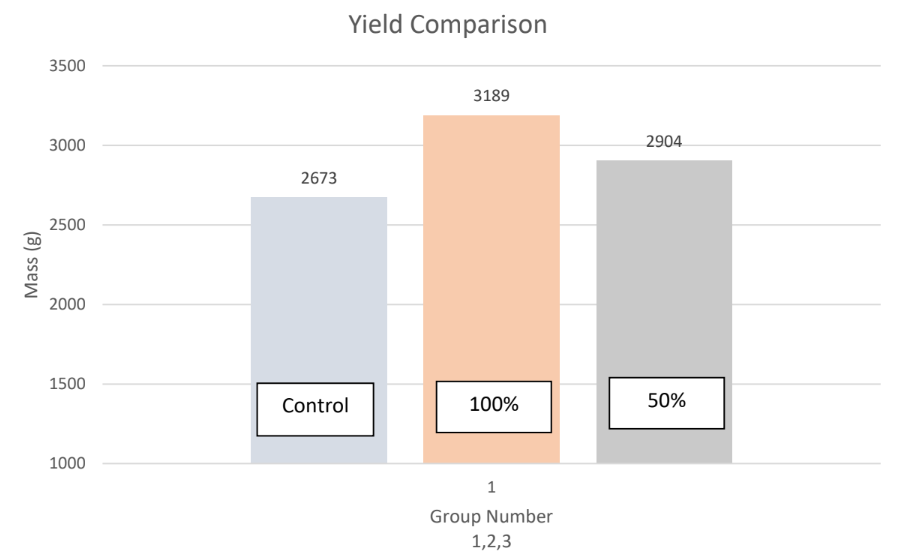
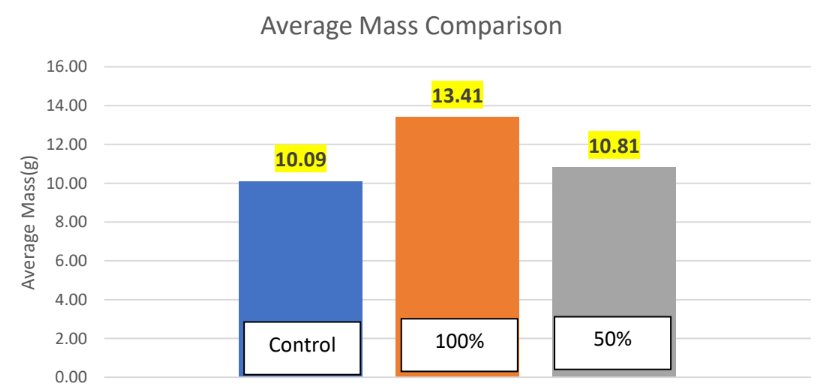
Based on the yield comparison across the 3 groups, Group 2 (100%) had the greatest yield at 3189g followed by Group 3 (50%) at 2904g and lastly Group 1 (Control) at 2673g. Group 2 had a 19% increase in yield compared to group 1 and a 10% increase in yield compared to group 3. Group 3 had a 9% increase in yield compared to group 1.
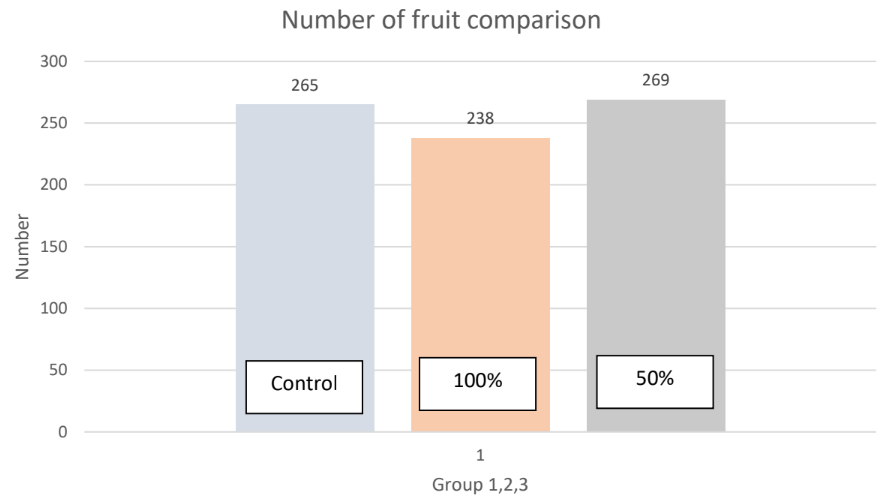
Based on the number of produce comparison, Group 3(50%) had the greatest number of produce at 269 pieces, followed by Group 1(Control) at 265 pieces and lastly Group 2(100%) at 238 pieces.
Pests and Diseases
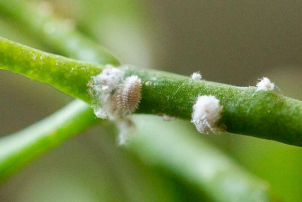
Throughout the experiment, the plants in all 3 groups were attacked by pests and diseases. The only pests observed were the mealybugs (Pseudococcus longispinus), suggesting that the other pests did not attack the plants. The mealybugs only appeared at the end of the experiment.
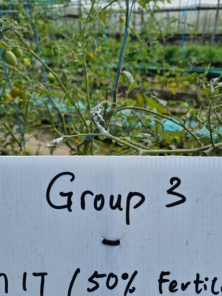
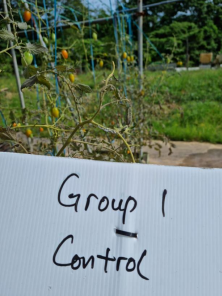
There is a virus present in all 3 groups attacking the plants.
Observations
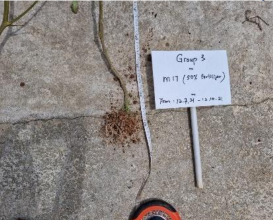
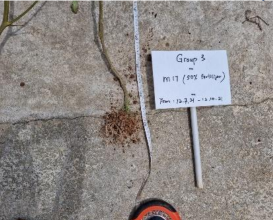
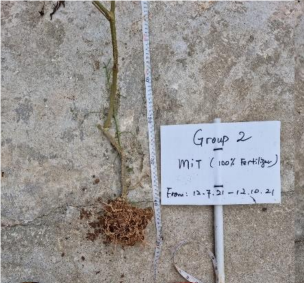
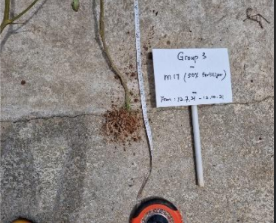
At the end of the experiment, 3 plants from each group were uprooted, the height of the plant and the length of the roots were compared with each group. The 3 plants were chosen based on the thickness of the stem.
Plant height: Group 1
Plant 1: 2.27 m

Plant 2: 1.94 m
Plant 3: 2.4 m
Average: 2.2 m
Plant height: Group 2
Plant 1: 2.4 m
Plant 2: 2.05 m

Plant 3: 1.72 m

Average: 2.05 m
Plant height: Group 3
Plant 1: 2.34 m

Plant 2: 2.05 m
Plant 3: 1.67 m
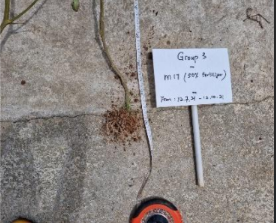
Average: 2.02 m
Based on the results obtained, the height of plants in Group 3 appear to be the highest followed by Group 2 and lastly Group 1 according to the average height calculated.
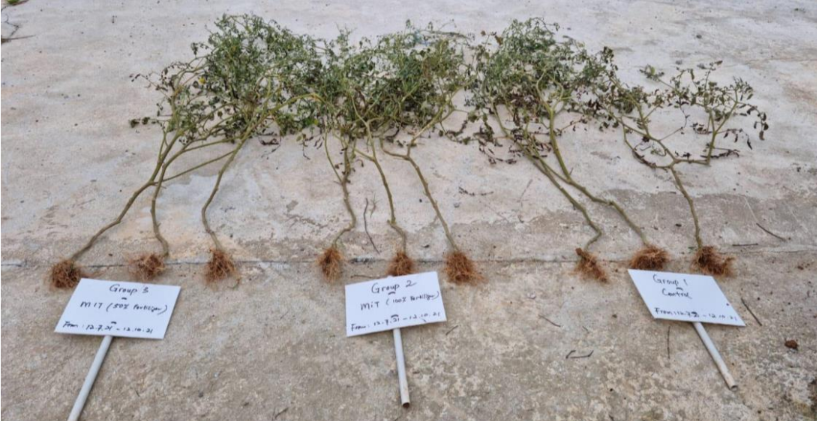
Root length observation
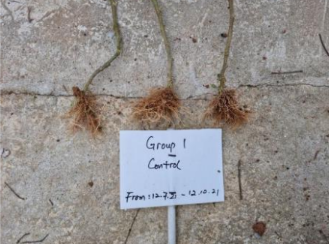
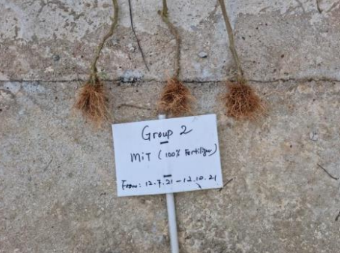
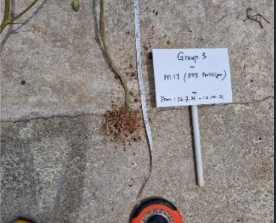
Based on observations, the root length for all 3 groups are roughly the same despite the plants having varying heights and thus we can conclude that the height of the plant and the root length has no correlation to yield.
Blind Test Result
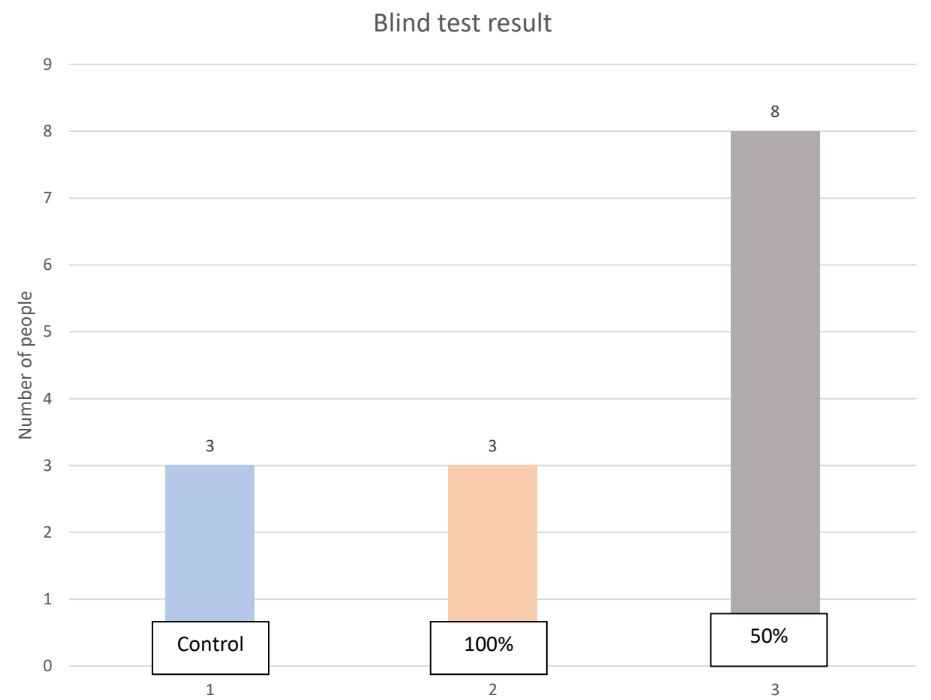
Based on the blind test results, we can see that majority of the people agree that the fruits from Group 3 are the best tasting ones whereas the fruits from Group 1 are the bad tasting ones.
Conclusion
At the end of the experiment, the plants in Group 1 were at the verge of dying whereas there were still more fruits that could be harvested from the plants in Group 2 and Group 3 and thus based on our observations that the addition of microbes is able to prolong the lifespan of cherry tomato plants.
We also observed that between Group 1 and Group 3, although group 3 had a lower fertilizer percentage, with the addition of microbes we observe that the yield and number of fruits produced in group 3 was better than the ones in group 1. Thus, by adding microbes to 100% fertilizer it should increase the yield even more as seen in group 2. In the blind test result, 61% of the participants agreed that the cherry tomato in group 3 was good while 23% agreed that the cherry tomato in 2 was good. The remaining 16% said that group 1 was good. Thus, we observe that the addition of microbes has improved the tastes of the cherry tomatoes.
